Changes in test and measurement technologies blur the boundaries between platforms and offer new options to engineers.
Introduction
For generations of radio frequency engineers, the rules were simple: if you wanted to observe a signal in the frequency domain, you used a spectrum analyzer, and if you wanted to study a signal in the time domain, you used an oscilloscope. The classic spectrum analyzer was basically a frequency mixer that used a local oscillator to search for signals over a range of frequencies. The oscilloscope was even more basic: it used the voltage of an incoming signal to bounce the CRT beam up and down the screen to show how the signal changed over time. Frequency domain measurements (output frequency, band power, signal bandwidth, etc.) were performed with a spectrum analyzer, while time domain measurements (signal width and repetition rate pulses, signal timing analysis, etc.) an oscilloscope was used.
As the digital revolution made signal processing techniques easier and more widespread, the lines between the two platforms began to blur. Oscilloscopes began to incorporate Fast Fourier Transform (FFT) techniques that converted time domain traces to the frequency domain. Spectrum analyzers began capturing their data in the time domain and using post-processing to display it on the screen. Even so, there were still major differences between the two platforms. Oscilloscopes were limited by the sample rate. They did see DC signals, but only a few GHz. Spectrum analyzers could see the microwave range, but their sweep failed to identify transient signals.
What if you needed to see a time-domain signal that had a carrier frequency of 40 GHz? What if you had to capture a broadband pulse in the X band? With advances in electronic warfare, radar, and communications technologies, the demands placed on test equipment are increasing.
Digital processing technologies have translated into new possibilities, not only for all RF and microwave equipment, but also for test equipment. Spectrum analyzers and oscilloscopes can do much more now than just a few years ago, and as their capabilities expand, the lines between them are blurring, and in some cases disappearing altogether.
It should be noted that the decision to view the signal in either the frequency domain or the time domain is not an important factor when deciding which platform to use. There are several data analysis software packages (such as Agilent's 89601B) that simultaneously display time and frequency data, as well as many other analysis modes. With this type of software to process the data, it no longer makes sense to classify the spectrum analyzer as a "frequency domain" device and the oscilloscope as a "time domain" device.
changes in technology
The digital revolution has changed the operating principles of spectrum analyzers and oscilloscopes:
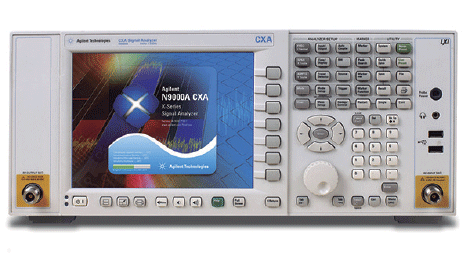
Spectrum analyzers: most of today's spectrum analyzers incorporate a fully digital signal processing (DSP) section. Like a classic spectrum analyzer, the incoming signal is down-converted to a much lower Intermediate Frequency (IF). That signal is sampled, digitized using an analog-to-digital converter (ADC) and processed using DSP techniques. The spectrum analyzer now offers two modes of operation: local oscillator sweep, to view signals over a wide range, or local oscillator “pause”, to simultaneously view everything that is happening in the analysis bandwidth that the spectrum analyzer allows. sampling rate.
The main advantage of this technique is the improvement in precision and reliability: replacing analog components with digital processing significantly reduces the uncertainty inherent in analog components. Components of classic spectrum analyzers, such as Resolving Bandwidth (RBW) filters and log amplifiers, are now implemented digitally with higher accuracy and repeatability.
"Pausing" the local oscillator and collecting data around a frequency provide two additional benefits. First, they allow you to view a broadband signal in the time domain. Since the signal is now sampled and digitized, it can be displayed in the time domain, just as an oscilloscope does. The main difference is that the spectrum analyzer data has been down-converted, so the displayed data is presented relative to the center frequency of the measurement. Second, they allow you to see the phase information of the signal. By applying a simple DSP, signals such as communications signals and radar chirps can be demodulated and phase analyzed. Some manufacturers call spectrum analyzers with this feature "signal analyzers" to reflect this new ability to demodulate and analyze the signals present on the carrier.
However, the signal analyzer still has a major limitation: the sampling rate of the ADC in the digital IF section. The analysis bandwidth of a signal analyzer is directly dependent on the sampling rate of its ADC, determined by the Nyquist frequency. At the time of writing, with an IF sample rate of up to 400 Mmu/s, analysis bandwidths of up to 160 MHz can be achieved.
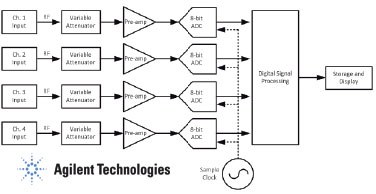
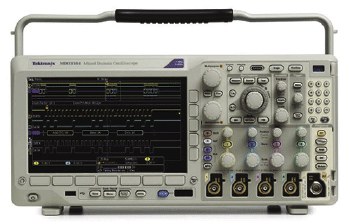
Oscilloscopes: As with the IF section of signal analyzers, signals incident on the input of an oscilloscope are digitally sampled and processed, but at much higher rates. While a signal analyzer is limited to "analysis bandwidth" by its local oscillator down-converter and slower ADC, an oscilloscope can view the entire range of frequencies from DC to many GHz at once. There are now real-time oscilloscopes that can sample at rates of up to 160 Gmu/s. Sampling at these high rates allows the oscilloscope to see signals from DC up to 63 GHz while staying within the Nyquist limit of the ADC.
There are some factors that can limit the usefulness of this architecture. One of them is the avalanche of data that is obtained with such rapid sampling. Hundreds of gigabytes of data are generated every second, and typically only fractions of a second can be simultaneously captured and analyzed if full bandwidth is used. Data processing techniques such as segmented memory can extend the capture time, but only for pulsed signals or repetitive signals. Another thing to remember is that high-speed ADCs typically offer only 8-bit resolution, as opposed to the 14-bit and 16-bit ADCs built into signal analyzers. However, in many applications this difference is not a problem as high-speed oscilloscopes integrate processing methods that take advantage of their faster sampling to reduce noise and increase dynamic range in the frequency domain. When looking for low-level signals over a wide frequency range (for example, a spurious search), the spectrum analyzer offers an advantage, but in most communications and radar applications, the differences between the two pieces of equipment They will have little effect on the results.
The Right Instrument for the Job: If both instruments are capable of analyzing RF and microwave signals, what would be the guidelines for choosing one over the other? Although the two techniques overlap, there are some basic differences.
Carrier frequency and signal bandwidth: the most important parameter to take into account is the bandwidth of the signal to be analyzed. If the carrier frequency is greater than a few GHz and the signal is within the signal analyzer's bandwidth, this device is often the best value for money. The spectrum analyzer's slower sample rate will allow you to capture and analyze data for longer. In addition, spectrum analyzers are often less expensive than equivalent oscilloscopes at frequencies of 10 GHz or higher. However, if you want to analyze wideband signals with a bandwidth of 160 MHz or higher, or if you need to see rise and fall times less than 20 ns, the oscilloscope is the best choice.
Resolution of voltage (power) and noise level: data resolution can also be an important factor. As a general rule, spectrum analyzers sample data at 14 bits, while the most common oscilloscopes are 8-bit devices. Also, since the oscilloscope has a wide input (without filtering like a spectrum analyzer), more broadband noise can penetrate into the measurement. This can be a problem in environments that contain high levels of noise or background signals. However, as mentioned above, there are many applications where oscilloscope data processing techniques can reduce or eliminate this difference.
Number of data channels: the spectrum analyzer is a one channel device. Oscilloscopes are usually equipped with four channels. Although multiple spectrum analyzers can be coherently connected, it is neither easy nor cheap. For making measurements on two, three or four channels, oscilloscopes have a natural advantage.
Examples: To illustrate the practical effects of these differences, here are the advantages and disadvantages of spectrum analyzers and oscilloscopes when dealing with common signals:
Radar signals (static carrier frequency): Typical radar signals typically have a relatively low bandwidth (<100 MHz) but a high carrier frequency. If the bandwidth is within the analysis bandwidth of the signal analyzer, the logical thing to do is to choose this instrument. The signal analyzer will offer higher resolution and longer capture times, typically at a more affordable price. However, for radar signals with a bandwidth greater than 160 MHz, an oscilloscope may be needed to view the entire signal at once without sweeping. One way to increase the analysis bandwidth without having to use a high-speed oscilloscope is to use a spectrum analyzer as a tunable down-converter and pass the IF signal to an external 1 GHz oscilloscope. This method allows you to analyze signals with bandwidths of several hundred MHz. Calibration routines exist to correct for the frequency response of the IF path and other factors.
Frequency Hopping Signals: If the signal hops within the signal analyzer's analysis bandwidth, the signal analyzer allows uninterrupted data collection for several seconds (in some cases, even hours or minutes using an external RAID array), while the high speed oscilloscope will only capture a few milliseconds. However, if the frequency range of the signal being jumped is wider, the user will either have to use a quick oscilloscope or, with some effort and creativity, develop an array of signal analyzers or down converters and digitizers to monitor different parts of the spectrum.
Wideband communications signals: A high-speed oscilloscope can be a great tool for demodulating and analyzing communications signals with symbol rates greater than 100 MHz. You can typically make Ka and Ku band measurements of signals with symbol rates of several GHz.
Finding Small Signals: The key to finding spurious and other low-power signals is to limit the amount of noise in the measurement. The ability of signal analyzers to perform narrowband sweeps over a wide range of frequencies, thereby removing most of the broadband noise, makes them an ideal tool for small signal searches.
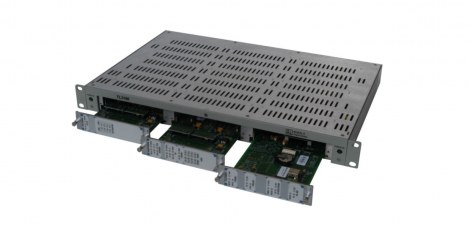
Multi-Channel Signals – For certain applications, such as phased array radars, multi-antenna detection systems, and MIMO communications, it may be preferable to analyze and compare a dozen or more signals at the same time. In this case, oscilloscopes have a natural advantage, since they are 4-channel devices with time coherence. Relative measurements between channels can be made with a spectrum analyzer, but multiple devices and some configuration are needed to achieve consistency. To work with more than 4 channels, the best thing to do would be to set aside the two technologies that we have talked about and bet on a matrix of digitizers. Without the high cost of spectrum analyzers and oscilloscopes and without the need for additional components, digitizers can prove to be a compact and affordable solution for multi-channel analysis. The drawback is often the additional work required to set up the array and process the data.
Conclusions
As a result of the incorporation of digital signal processing techniques in spectrum analyzers and oscilloscopes, the boundaries that separated both techniques have been blurred to such an extent that, for certain applications, the best spectrum analyzer may be an oscilloscope and at the same time reverse. In either case, users will find that today's instruments are far more capable and powerful than those available just a decade ago.


