Introduction
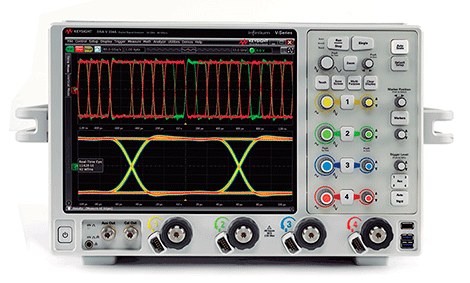
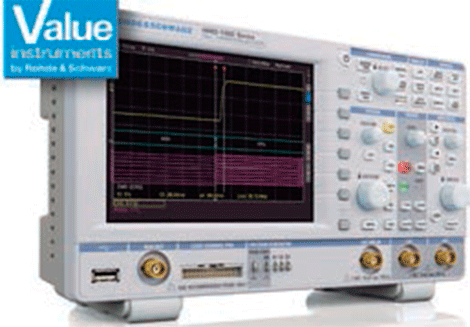
A real-time oscilloscope has always been a powerful tool for high-speed memory designers doing electrical or parametric certification testing, debugging, and DDR characterization. With the limited channels of a real-time oscilloscope, it can be difficult to trigger on a DDR protocol and decode to separate the read and write data from the bi-directional data bus. With an additional 16 high-speed digital channels, a Mixed Signal Oscilloscope (MSO) allows the designer to probe, decode, and trigger on the DDR command bus to accurately identify read and write cycles. This article describes how an MSO for the separation of write and read data can be used for full testing, debugging, and characterization of DDR designs.
Why use an MSO?
DDR Read/Write Cycle Behavior
Let's start by analyzing the behavior of DDR read and write signals on a limited number of analog channels. There are ways to identify read and write data on the bidirectional bus by analyzing the data strobe (DQS) and the data (DQ).
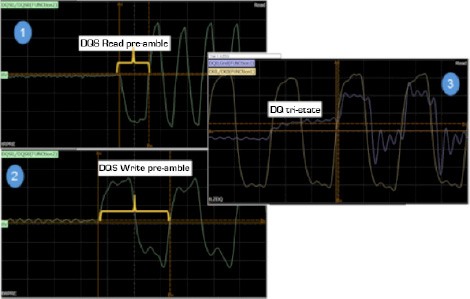
Figure 1 shows the read and write data of a DDR3. As you can see, the preamble read and write patterns of a DDR3 are clearly different. The read preamble goes from the Hi-Z (high impedance) state down before the first rising edge of the DQS to signal the first read data bit. The write preamble goes from Hi-Z (high impedance) up, then down before the first rising edge of the DQS to signal the first write data bit. And finally, the DDR3 DQ signal is usually in a Hi-Z state before it transitions to data valid.
Figure 2 shows the behavior of the strobe and the DDR4 data. The DDR4 preamble read and write patterns are very similar to each other. DDR4 uses pseudo-open drain drivers instead of “push-pull” drivers like DDR3 to reduce current draw. Here the DQ signal shows a high state instead of the DDR3 Hi-Z state between data bursts. This level is adjustable or disabled and the DQ signal may look different than the nominal setting seen here.
DDR Read/Write Separation Methods
When testing and validating DDR designs, one of the biggest challenges facing the designer is the separation of read and write data on the bidirectional lines. Figure 3 is a DDR2 signal that, like DDR4, has a similar preamble for both reading and writing. With a single edge trigger on DQS, the read and write data overlap. To make valid electrical and time measurements, read and write data must be separated. There are several ways to separate the read and write cycles.
The easiest is using a software identification trigger. By drawing a zone in a distinct read or write burst pattern, we can separate read and write data. Separated write data is shown in Figure 3. We know this because write data is usually center aligned, while read data is usually edge aligned.
Another method of performing read or write data measurement is automated testing application software. Based on the relationship of DQS and DQ, the software would automatically perform an informed analysis of the input and output measurement. The method or algorithm commonly used to do so is through the phase alignment of DQS and DQ. Software could also use the preamble pattern to distinguish read and write data.
In DDR3, the preamble read and write patterns are different, so it makes sense to use the preamble pattern to separate read and write data. But for DDR2 and DDR4, which have the same preamble patterns and often different behavior than a DDR3 system, it could cause the software to misidentify a read or write cycle if the difference in phases weren't obvious. An example of a read cycle is shown in Figure 4 where some data is not exactly edge aligned and could be misidentified as a write cycle.
DDR read/write protocol
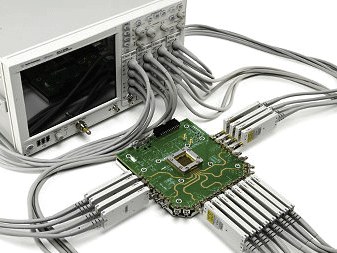
While these two methods of separating read and writing using only DQS and DQ are valid and useful ways of separating, they lend themselves to separation errors and ultimately incorrect measurements. The clearest way to separate read and write data would be command decoding using the DDR command truth table available in the JEDEC specification. Before MSOs existed, this method could only be accomplished using a logic analyzer or protocol analyzer. This method requires access to at least 5 command pins, which include CLK, CS, RAS, CAS, and WE. With an MSO, there are 16 digital channels, in addition to the standard 4 analog channels. An MSO can decode read/write commands and trigger on the command to view the analog behavior of the corresponding DQS and DQ signals over the analog channels.
For LPDDR technologies, there is also a similar command truth table that can be used to decode commands. But instead of RAS, CAS, and WE, it would connect to CA0, CA1, and CA2. In LPDDR technology, the command and direction signal share the same pin.
Using an MSO to trigger and take measurements?
Trigger and search protocols
There are 3 basic steps you should take to correctly configure the MSO for DDR decoding. First, assign the channels to the correct bus. Secondly, define the voltage thresholds, normally VREF of the signal.
Finally, define optional signals for further decoding. DDR signals sometimes have different VREF levels between command buses.
As speed increases, this feature becomes very common. You may need to probe the signal on an analog channel to see what the actual voltage swing is until you find the optimum voltage reference point. And there may be several depending on trace lengths or probe used and other signal integrity factors.
The MSOs currently on the market incorporate standard triggering and decoding for DDR technologies (DDR2/3/4, LPDDR2 and LPDDR3).
The protocol decode menu allows you to assign channels to all buses that make up a DDR command decode. There are some buses that are required for a command decode; for example, RAS, CAS, WE, and CS.
If you have access to additional signals, you will have more command options. For example, accessing CKE would allow you to decode shutdown input and shutdown output commands.
Note that the capability resides in the MSO hardware and there is no need to configure token files to map channels to a command protocol. There is also the option to decode more buses as the address.
Finally, the next thing you'll want to do with your MSO is fire on command. You have the option to trigger on a single command or you can trigger a DQS associated with a read/write command. This triggering feature is what makes the MSO so powerful for DDR debugging.
The next thing to configure is the trigger on the DQS associated with a read or write command. For example, if we wanted to trigger on the first valid read burst, we would use this trigger function along with an input of what the read latency is.
Latency is the number of clock cycles from the first valid command to the first valid burst after the preamble.
We can then align the first bit of the read DQS and make it jitter free for timing or eye diagram measurements.
Eye diagram measurement in DQS/DQ
Now that we know we're shooting evenly on the write data, let's do some more analysis and perform a real-time eye measurement. Using the horizontal sync math function, we can specify a specific portion of a burst that we are interested in measuring. We can now set up the eye measurement using the eye diagram wizard: the clock is function 1, the gated channel 1 of DQS and the data would now be function 2, which is the synchronized function of channel 2, DQ. Measurements of eye height, eye width and mask can now be made. Figure 11 shows the measurement of an eye mask and the deployment of the eye on a signal analysis failure. To do this, set the eye diagram to stop on failure. Once it stops, select the eye drop. We can clearly see where the fault is and analyze and drive some specific electrical and timing measurements on that waveform to determine the root cause.
Summary
With data transfer rates increasing, it is more important than ever to accurately analyze and measure data read and write times. An MSO is a powerful tool to help trigger and detect the signals that you want to measure and analyze. These measurements can be performed in a precise and efficient manner.


