The use of magnetic resonance (MR) scanners has increased enormously in the last three decades. Although traditional radiographs are still commonly used to diagnose broken bones and certain soft tissue pathologies, today MRI has become an important clinical diagnostic tool. It offers a non-invasive method to obtain internal images of the human body and diagnose diseases such as ligament injuries, brain tumors or spinal cord injuries.
One of the main components of MRI is the horizontal magnetic tube where the patient is positioned during the procedure. As a general rule, this tube is composed of superconducting magnets formed by coils excited by electric current, so that they create a powerful magnetic field inside the tube that forces the hydrogen nuclei located inside the human body to align parallel or antiparallel to the magnetic field.
During the MR procedure, an RF amplifier injects the RF excitation signal (typically in the 40 to 300 MHz range) into the magnetic tube, causing nuclei that are in a parallel state to go into an antiparallel state. . After the RF excitation ends, the nuclei in the antiparallel state will gradually return to the parallel state spontaneously. These changes cause body tissues to emit electromagnetic radiation that MRI measures to determine the structural characteristics of those tissues.
The power accuracy of the RF amplifier that controls the RF drive signal is periodically checked and adjusted when necessary to ensure that it meets regulatory specifications. Verification and adjustment can be done using test equipment such as a power meter or oscilloscope.
Verification and adjustment of RM with an embedded power meter
Power meters provide good accuracy and intuitive measurements, as they display measured power in the user's preferred unit: kW or dBm. If you use an oscilloscope, you can refer to a peak-to-peak voltage (Vpp) table that maps it to power in kW or dBm. [Note: To do this, the Vrms value of Vpp must first be obtained and then converted to wattage using the formula V2rms/R, where R is the input impedance of the metering system.]
Power meters are capable of tracking and measuring the RF power envelope over a wide dynamic range of usable power and frequency band. They offer oscilloscope-like triggering and flexible measurement setup. If everything is normal, the power meter will display the RF excitation pulse signal, as seen in Figure 1.
Most meters can quickly and accurately measure the average power and peak power of a driving signal in the form of a pulse (rectangular, trapezoidal, sinusoidal, etc.). It is normal to obtain measurement speeds of more than 40 readings per second and an accuracy better than 5% over the entire range of operating frequencies. Accuracy can be traced to national standards from accredited national laboratories, eg NIST (US National Institute of Standards and Technology) or NPL (UK National Physical Laboratory). In view of these advantages, the use of power meters to perform MR checks and adjustments in hospitals, laboratories, and manufacturing plants has spread considerably among engineers and technicians.
Conventional power sensors (the power meter sensing device) only work in the dynamic power range of 1 nW (-60 dBm) to 100 mW (20 dBm). In order to be able to use a power sensor to measure RF signals for MR, which are typically in the kW range, it is first necessary to reduce the input power by connecting a directional coupler or attenuator to the power sensor to form a meter. interleaved power (Figure 2).
If a coupler is used, by selecting the proper coupling factor it is possible to attenuate an RF drive signal emitted at extremely high power from the RF amplifier to a lower power level in the coupling arm, where it can be measured with a conventional power sensor. For example, to measure an RF excitation signal with an average power of 2 kW (63 dBm), one can use a coupler with a coupling factor of 60 dB, which will reduce the power level by up to 3 dBm at the output. of the linkage arm.
In field applications, the input of the coupler is connected to the output of the MR RF amplifier, the output of the coupler is connected to a high-power load, the power sensor is connected to a forward-coupled port, and the forward-coupled port backwards you end up with a load of 50 Ω. Depending on the application, the back-coupled port 50 Ω terminating load is sometimes replaced with a power sensor to measure the RF power reflected from the high-power load. In those cases, the power level of the RF drive signal is measured at the forward coupled port.
Most of the incident power (RF drive signal) traveling through the coupler is dissipated as heat (a coupler with 0,1 dB insertion loss will cause about 2,28% dissipation). input power as heat inside the coupler housing), or is absorbed by the high power load.
Techniques for characterization and calibration of the interleaved power meter
Before using the embedded power meter to perform MR adjustments, it is necessary to correctly characterize and calibrate the directional coupler and power sensor using traceable test equipment to minimize mismatch and errors between connection interfaces, thus improves the accuracy and repeatability of measurements.
To carry out the calibration, it is best to have all the components connected forming a single system, that is, connect the coupler to the power sensor and this to the power meter. The test set then injects a signal into the coupler input to acquire the responses of the embedded power meter. However, a high coupling factor increases the difficulty of calibration, since it drastically reduces the signal-to-noise ratio (SNR) in the power sensor. The alternative is to use a very high power amplifier in order to provide enough power to the coupler to generate a reasonable SNR as it enters the power sensor. The drawback of this approach is that the test system has higher initial and maintenance costs.
There is a more effective and cheaper technique: calibrating the power sensor, power meter and directional coupler separately.
The characterization of the embedded power meter is basically made up of three parameters: frequency, power and temperature calibrations. By characterizing these three parameters, the embedded power meter will provide an accurate and repeatable result for measured instantaneous frequency, input RF power, and ambient temperature.
Calibration of frequency responses
Using the most economical calibration technique, the frequency responses of the power sensor and the coupler are calibrated separately. Both the standing wave coefficient (VSWR) and the frequency response of the power sensor are measured. The coupler can be calibrated using a vector network analyzer to obtain the s parameters, which indicate the RF characteristics of the device such as RF mismatch, insertion loss, coupling factor, and directivity. Next, the frequency responses of the power sensor and the coupler are mathematically combined using Mason's rule.
Mason's Rule is a general formula derived from the signal flow model of an RF system, which in this case is a 4-port device, as illustrated in Figure 3.
The effective coupling factor looking from port 4 (the forward coupled port that is connected to the power sensor) can be calculated using Mason's rule
where:
The result of this calculation combined with the frequency response of the power sensor makes it possible to obtain a combined frequency response.
An example of a combined frequency response is shown in Figure 4.
The graph shows the frequency characteristic referenced to 50 MHz. The data is used to compensate for the error at each frequency point of the measurement.
Temperature and power calibration
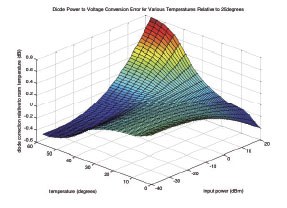
While power calibration affects the linearity calibration of a device, temperature calibration ensures that measurement results are accurate at various operating temperatures. Nearly all RF sense diodes (the sense IC inside the power sensor) behave linearly within the square-law region typically below the -20 dBm power level and exhibit nonlinearity above of -20 dBm. In other words, the RF detector sensitivity varies non-linearly above -20 dBm, so performing linearity calibrations will ensure non-linearity error compensation.
The characteristics of temperature and power usually show a strong dependence, which is why these parameters are usually calibrated at the same time.
An example is shown in Figure 5. The main feature comes from the detection diode, while the rest of the electronics play a secondary role.
Conclusion
The ability to make precise and repeatable adjustments in MR RF power is critical to ensuring compliance with standards set by medical industry authorities. A reliable calibration technique will allow us to be sure that we achieve the objective.


