“Thanks to the modularity of the PXI, it has been possible to collect data from many different sources and through different protocols.
Using different VIs, data processing has been carried out and they have been homogenized.”
The challenge:
Measure and control the electrical parameters of a microgrid to achieve a controlled power profile exchanged with the grid, while keeping the storage elements at their optimum operating point.
Also access the database that allows you to analyze its operation.
The solution:
Carry out power control of the active elements of the microgrid using input data of a different nature, which through different PXI modules is capable of acquiring and managing.
In addition, dump the data obtained in a database managed in LabVIEW for further analysis.
Introduction
The research group in Electrical Engineering, Power Electronics and Renewable Energies (INGEPER), of the Department of Electrical and Electronic Engineering of the UPNa, within its lines of research in renewable energies, has implemented a microgrid based on renewable energies that serves to the study of said microgrids and their integration in the Smart Grid and therefore, for the study of the integration of renewable energies in the electrical network. This research has been carried out under the projects
"Design, development and implementation of microgrids in Navarra" financed by FEDER Funds through the Government of Navarra and the project DPI2010-21671-C02-01 financed by the Ministry of Economy and Competitiveness. For this purpose, a microgrid has been designed that serves as a test bench for renewable generators, manageable loads, storage systems, power converters and auxiliary elements such as network analyzers and other measurement equipment. For this, it is necessary to have a data acquisition element that is capable of using different communication protocols and that is as modular as possible, so that new elements can be added as they are coupled to the microgrid. The PXI platform is presented as the best solution since, in addition to offering compatibility with any type of analog or digital input, it is capable of processing this data in real time and returning the power setpoints to the microgrid actuators. Another added advantage is to implement virtual elements, which are simulated by the PXI, and are able to interact with the real elements as if they were actually installed. In addition, the implemented system is capable of dumping the data into a database on an auxiliary PC, which is also managed with LabVIEW. This database allows analyzing the results using the raw data, or using programs developed in LabVIEW that process the data to return the most relevant results, such as the energy balances of the microgrid on a given day, the analysis of the generators renewables or analysis of the quality of the power profile exchanged with the grid.
Data capture and monitoring
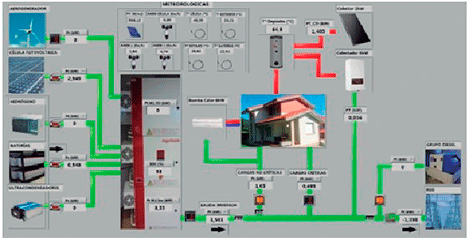
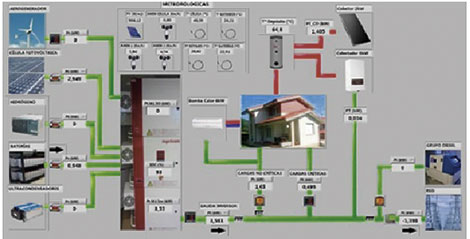
The data collected by the PXI comes from different measurement devices and from different manufacturers, which also use different communication protocols. On the one hand, the main electrical variables are obtained in the different nodes of the microgrid (voltage, current, power, frequency, etc.) that are measured with wattmeters from different manufacturers. These use Ethernet and RS485 communication which are picked up by the 8433/4 and 8231 modules respectively. In addition, all the electrical variables sent by the power converters and transmitted via RS485 are obtained. On the other hand, through the TB-2621 module, analog measurements of environmental sensors such as Pt100 temperature sensors, a calibrated cell for measuring irradiance and anemometers are collected at different points on the campus where the microgrid is located. The data collected by the PXI is sent to the PC via Ethernet, where it is displayed in real time in the SCADA-type control and monitoring station, which makes it possible to view the power flows in the microgrid, as well as any other electrical variable through drop-down menus. (Fig. 1). Likewise, the latest microgrid data is graphed in real time for a period that can range from 1 hour to 1 week, thus being able to see the evolution of different variables. Through the use of tabs you can navigate through the multiple graphs. In the figure. 2 shows one of the front panel tabs of this VI.
Control
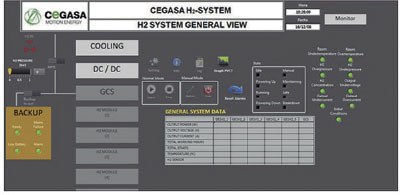
The control of the microgrid has been programmed in LabVIEW, transferred to the PXI and is completely autonomous. This control measures certain variables (power, state of charge of the batteries, environmental variables, etc.) and makes decisions with the aim of smoothing the power profile exchanged with the network by sending the necessary instructions to the variable loads, generators and accumulation items. This automatic control is carried out as long as it has been established in the control station. However, it is possible to switch to manual mode and control certain variables thanks to this second program that runs on the PC and communicates with the PXI (Fig. 3). Thus, through this program, the microgrid can be manually connected and disconnected from the electrical network and manually set the power exchanged with it. In addition, you can choose whether the external network is the national electrical network or a local network generated by a generator set. Finally, non-critical loads can be connected and disconnected manually by means of a remote controlled relay. In addition, this panel indicates the status of communications and relays.
Data analysis
To analyze the operation of the microgrid and study possible improvements in energy management strategies, it is necessary to save all the data that is generated. Thus, the PXI is also responsible for continuously uploading all the data to the PC via an Ethernet connection. These data are stored in an SQL database by means of a third VI executed on the PC. This database accumulates hundreds of data per second and its manual handling would be unfeasible. To manage it, two auxiliary VIs have been designed that facilitate the management of the database. By means of a first program, the user is capable of easily visualizing the data he wishes. Using a second program, you can dump the chosen data into a .txt or .xls file in case you want to export it to other programs.
Conclusion
Thanks to the modularity of the PXI, it has been possible to collect data from many different sources and through different protocols. Using different VIs, data processing has been carried out and they have been homogenized. These data are used by microgrid management programs for their control. On the other hand, all the information is sent to a PC that manages and stores the data in an SQL database for further analysis. This analysis is possible thanks to the VIs that allow the visualization and download of the selected data.


