Source response testing with arbitrary waveform generators and digitizers in one instrument
Within the world of electronic verification there are two types of evidence. Self-powered electronic devices such as power supplies, oscillators, transmitters, and signal generators are tested using data acquisition instruments such as digitizers, oscilloscopes, or spectrum analyzers. The second type of verification corresponds to devices such as amplifiers, filters, receivers and digital interfaces, which must be externally powered by means of a signal source in order to use signal acquisition instruments. This type of test is called a source response check.
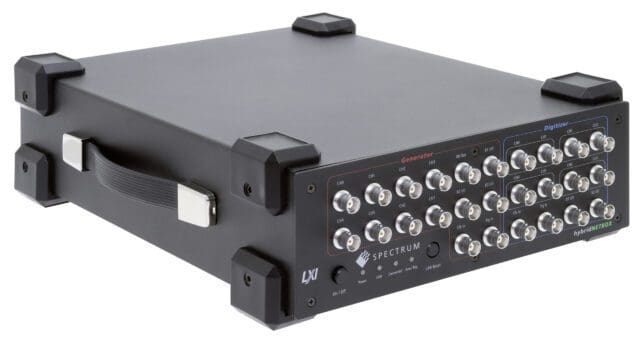
| Figure 1: Model DN2.806-08 with 8 16-bit channels for arbitrary waveform generation and digitization in an LXI-compliant housing. |
Spectrum Instrumentation's hybridNETBOX combines arbitrary waveform generators and multi-channel digitizers in one universal LXI-compliant instrument that is capable of providing stimulus and response measurements. It is a true all-in-one test system. Figure 1 shows a hybridNETBOX.
There are six different configurations of the hybridNETBOX with a sample and clock rate of 40, 80 and 125 megasamples per second (MS/s) in two, four or eight channels for signal generation and acquisition. Each channel has 16-bit resolution and a bandwidth of up to 60 MHz proportional to the sampling rate, so it provides the necessary technology to ensure that the digitization channels and generation of arbitrary waves offer exceptional levels of accuracy and precision. .
The arbitrary waveform generator can have from two to eight fully synchronized channels with common clock and trigger, internally or externally generated. The output levels of the arbitrary waveform generator can be up to ±6 V with 50 Ohms or ±12 V in high impedance for two or four channel versions or up to ±3 V with 50 Ohms or ±6 V in high impedance for the eight channel version. The capabilities of the arbitrary waveform generator are enhanced by the availability of four digital I/O lines for user-programmable marker pulses, as well as external clock and trigger inputs.
Two of the digitizer's eight channels handle a wide range of input signals from ±200 mV to ±10 V with adjustable DC offset and a user-selectable 50 Ohm or 1 MOhm input impedance. The digitizers incorporate single-ended and differential inputs. The digitizer also has an external clock and trigger input, as well as two user-defined general purpose I/O lines.
The hybridNETBOX is fully LXI compliant. Simply connect the instrument(s) to your computer or network via the Gbit Ethernet port on the rear panel and you're ready to go. The hybridNETBOX is also fully programmable and comes with drivers for Windows and Linux.
Spectrum Instrumentation supplies its SBench 6 software tool for control, visualization, measurement, and signal processing with its entire line of products. The software also allows the generation of reports. Additionally, in order to program the instruments for specific applications, examples are provided for C++, LabVIEW, MATLAB, Visual Basic .NET, Python, and other popular programming languages.
Checking the source response
The hybridNETBOX, which has up to eight signal generation and generation channels, has an ideal configuration for stimulus-response type measurement systems. Since a single hybridNETBOX can provide multiple transmit and receive signals, it is perfect for testing and evaluating bus-based or matrix-based MIMO systems. The hybridNETBOX is suitable for ATE applications by automatically testing components and subsystems and confirming device functionality and calibration.
As a simple example, let's take a measurement of the response of a source in which the AC open-loop gain of an operational amplifier is measured, using an arbitrary waveform generator and a digitizer. Figure 2 shows the test circuit.
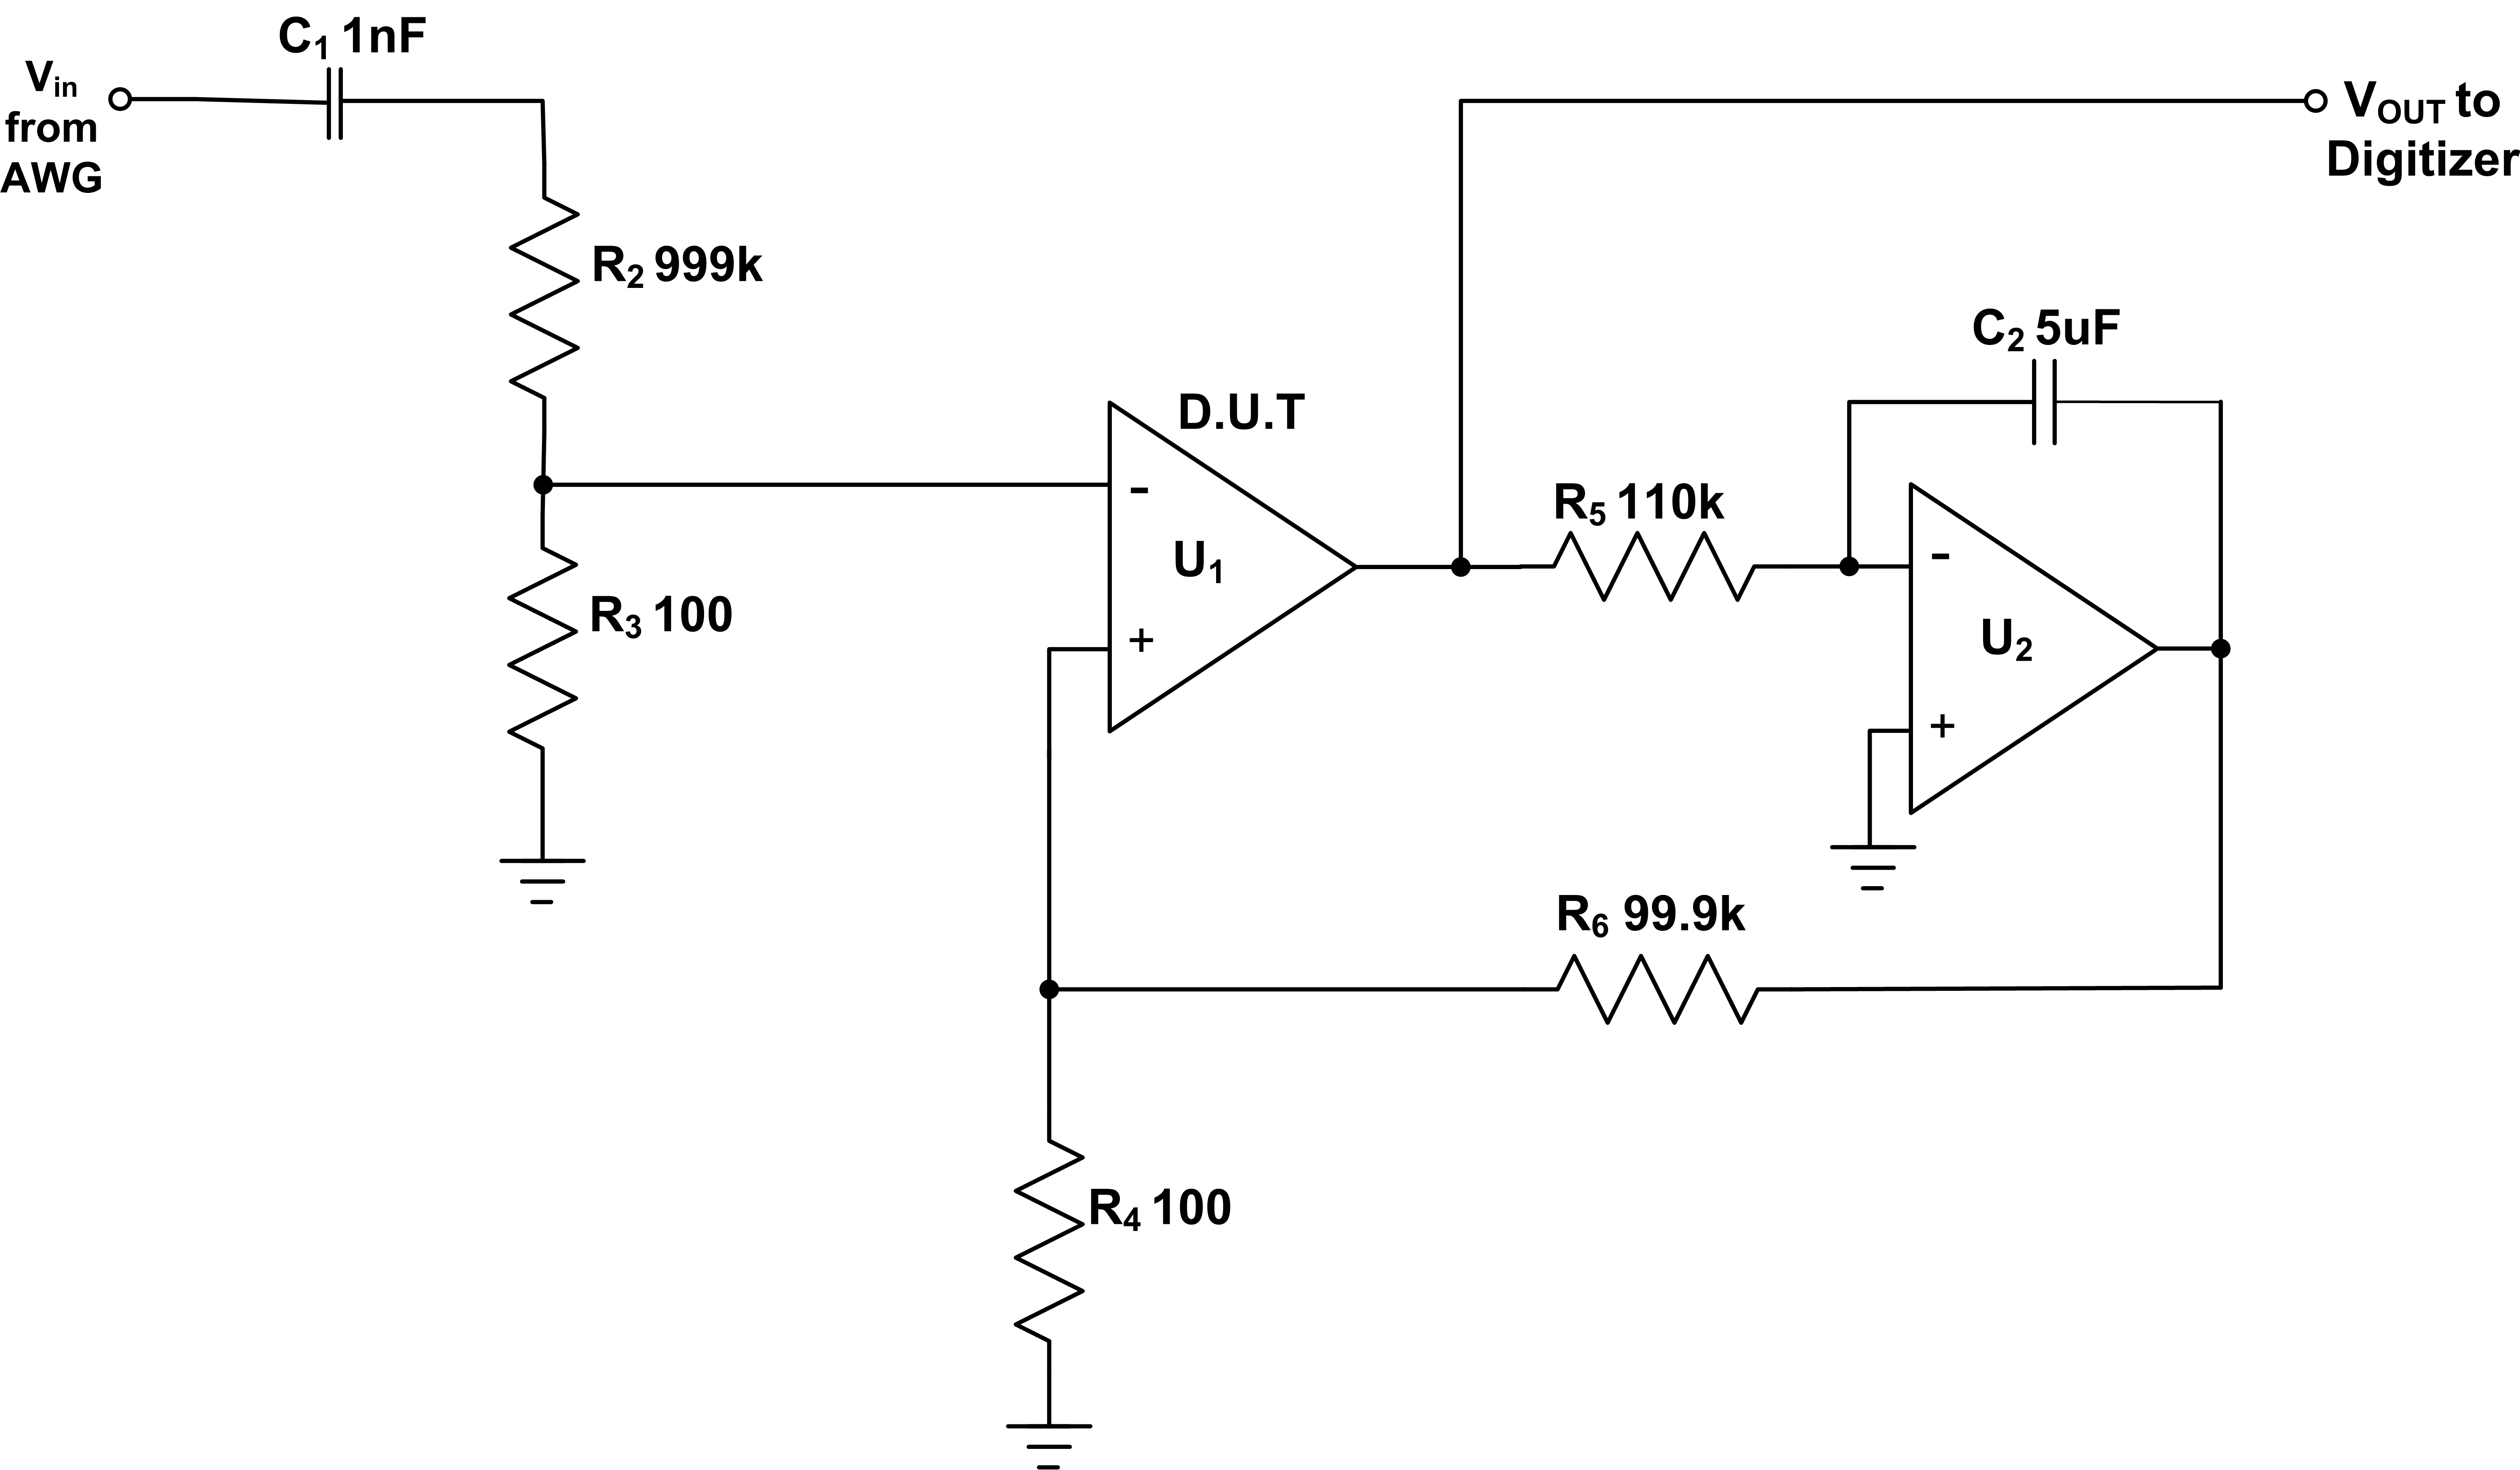
| Figure 2: Test circuit to measure the AC open-loop gain of an operational amplifier, using an arbitrary waveform generator as a source and a digitizer to measure the response. |
This test applies a small AC waveform from an arbitrary waveform generator to the input of the op amp under test. Since the gain of the amplifier is quite high, the input signal must be attenuated. A 10000 to 1 resistive attenuator (R1 and R2) decreases the input by 80 dB. Amplifier U1 is the device under test (DUT). U2 is an auxiliary amplifier that stabilizes the average DC level at the output of the DUT.
The AC open-loop gain is expressed as a function of frequency. The input waveform has to be a flat frequency response over the desired range of test frequencies. Waveforms that meet this requirement could be a linear sweep frequency or impulse function. The arbitrary waveform generator can be easily programmed to provide any of these signals using Spectrum's SBench6 signal processing and control software. SBench 6 allows you to create waveforms using standard functions, math equations, or can be imported from a digitizer or oscilloscope. In this case, a sine sweep from 100 Hz to 100 kHz is created with a sweep time of one second using equations. Sine sweep is chosen because it offers a greater dynamic range than an impulse function. The sweep signal is applied to the test circuit and a digitizer measures the output of the circuit during the sweep. The results are summarized in Figure 3.
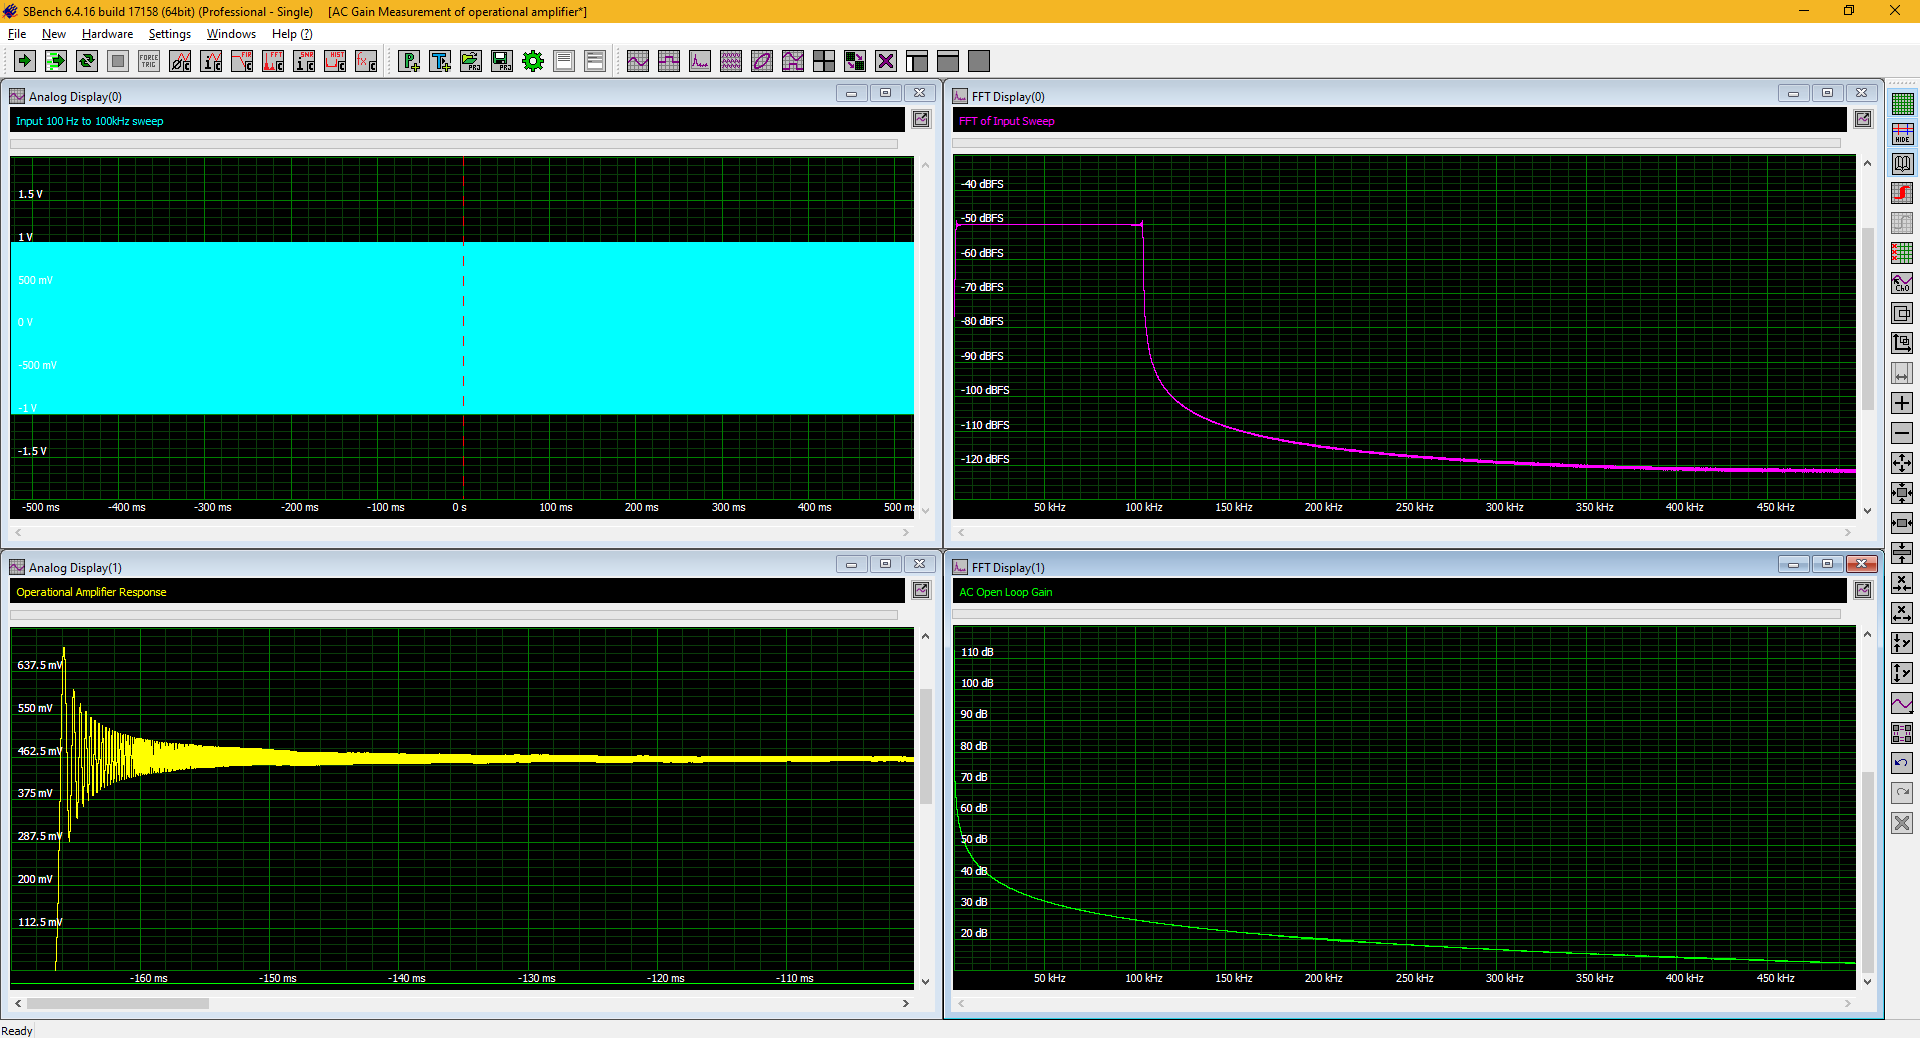
| Figure 3: The four main steps in AC open-loop gain measurement: signal generation (top left), input signal frequency range check (top right), signal acquisition output signal (lower left) and extraction of the frequency response of the output signal (lower right) which is the AC open-loop gain. |
The upper left graph shows the swept sinusoidal input signal over its total duration of
1 second to check how flat its amplitude is over time. SBench 6's signal processing capabilities include Fast Fourier Transform (FFT) calculation. The FFT displays signal power versus frequency just like a spectrum analyzer. The upper right graph contains the FFT of the input signal, thus verifying the flat frequency response between 100 Hz and 100 kHz. The response of the op amp to the attenuated input signal appears in the lower left graph. The input signal spectrum corresponds to the lower right graph and includes the amplitude correction for the 80 dB pad. This spectral representation is the AC open-loop gain. The AC gain is displayed between
100 Hz and 100 kHz with a maximum gain of 112 dB. The amplitude drops off with respect to frequency at -6 dB per octave or -20 dB per decade, which is expected for the op amp.
The hybridNETBOX, which contains both the hardware for signal generation and acquisition, facilitates this test. Note that there are up to eight channels of signal sources and digitizers, and that up to eight tests can be run simultaneously in parallel.
Record and playback app
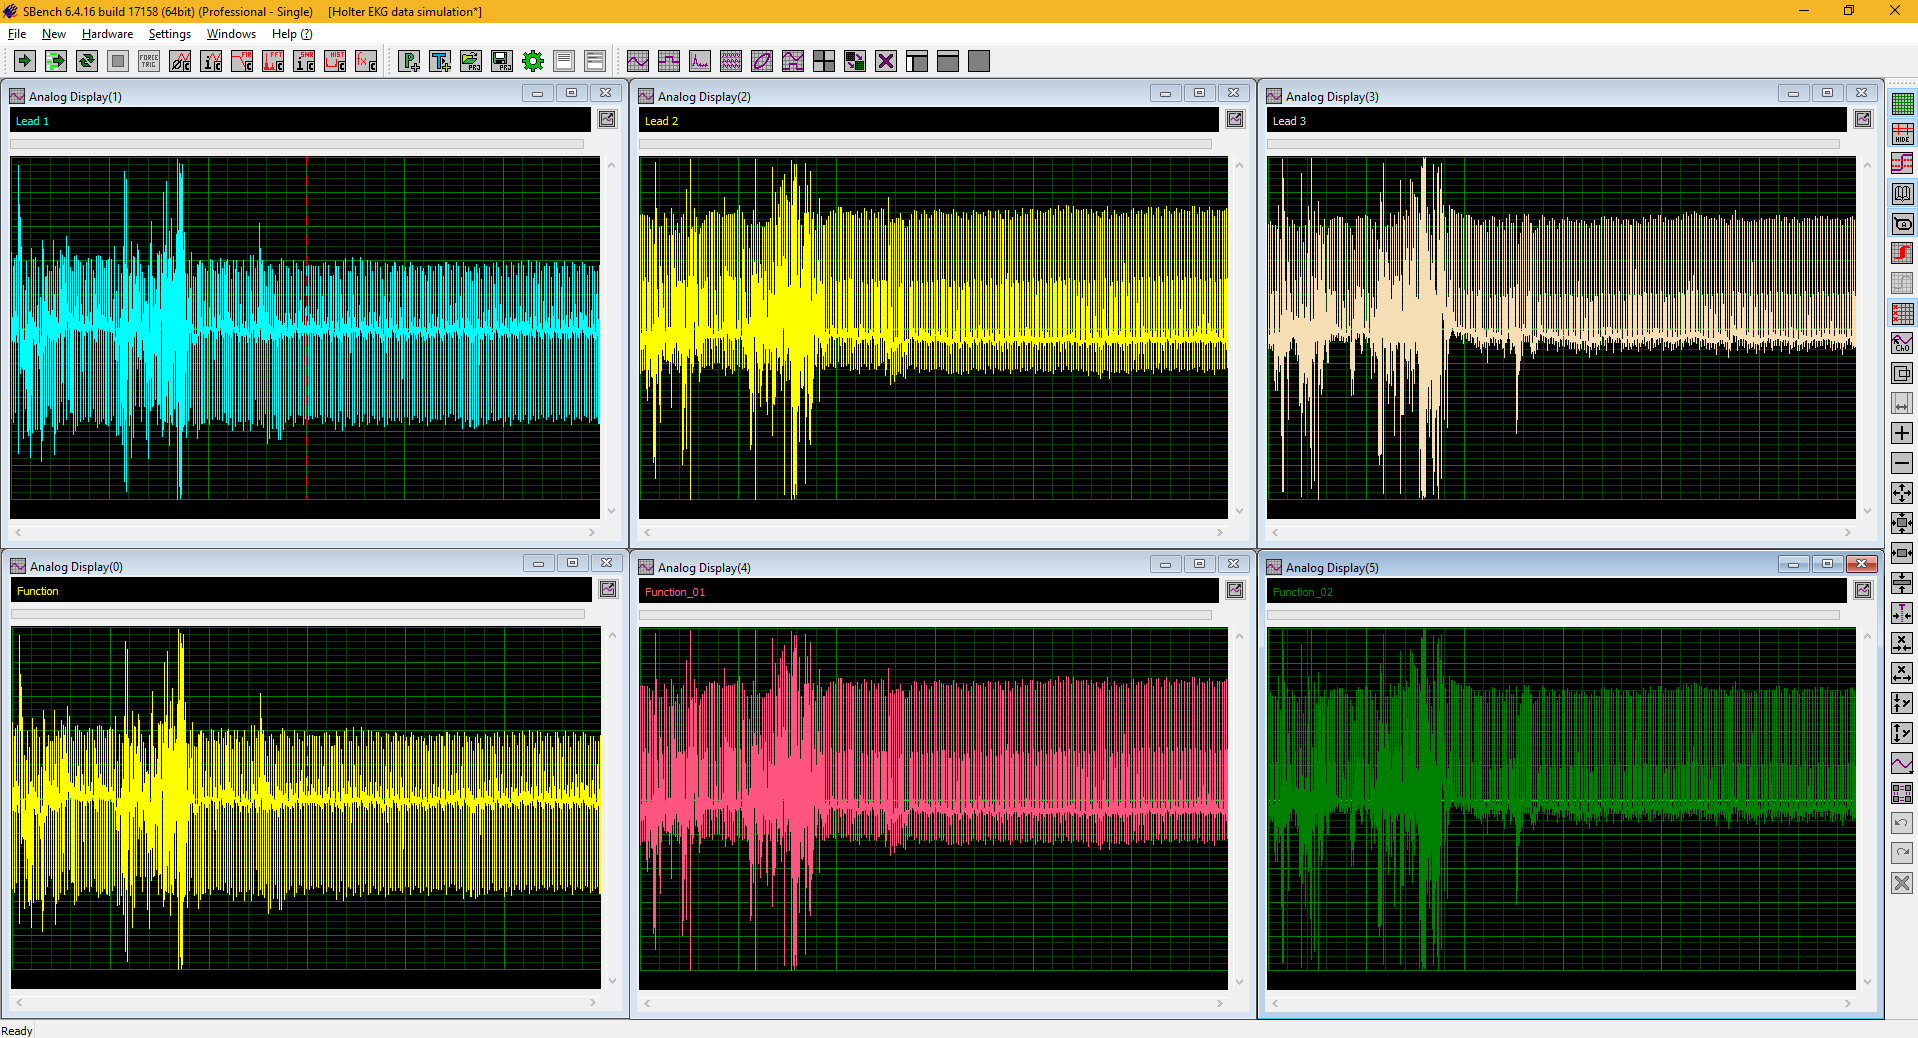
| Figure 4: Example of record and playback test strategy using a 1-lead Holter electrocardiogram recorder. The top three graphs are acquired on leads 3 through XNUMX. The signals are copied and reproduced as channels of the arbitrary waveform generator. |
Another handy feature of the hybridNETBOX is its ability to acquire one or more signals and then play them back when desired for simulation when needed to replace a missing subsystem. Consider, for example, the acquisition and reproduction of electrocardiogram signals from a three-wire Holter recorder. This would allow the circuit to be developed without a patient wearing the device. A library of pre-registered signals enhances this simulation capability. Figure 4 offers an example.
The top three graphs show the signal acquired on leads 1 through 3 of the recorder. These graphs are copied into channels of the arbitrary waveform generator named Function, Function_01, and Function_02. The acquired channels could also be improved thanks to SBench6's filtering and signal processing functions before leaving the arbitrary waveform generator.
Similarly, anomalies can be introduced into these signals and then transferred to the channels of the arbitrary waveform generator to supply them on demand. Figure 5 illustrates the addition of a 50 Hz anomaly to the cable 1 signal.
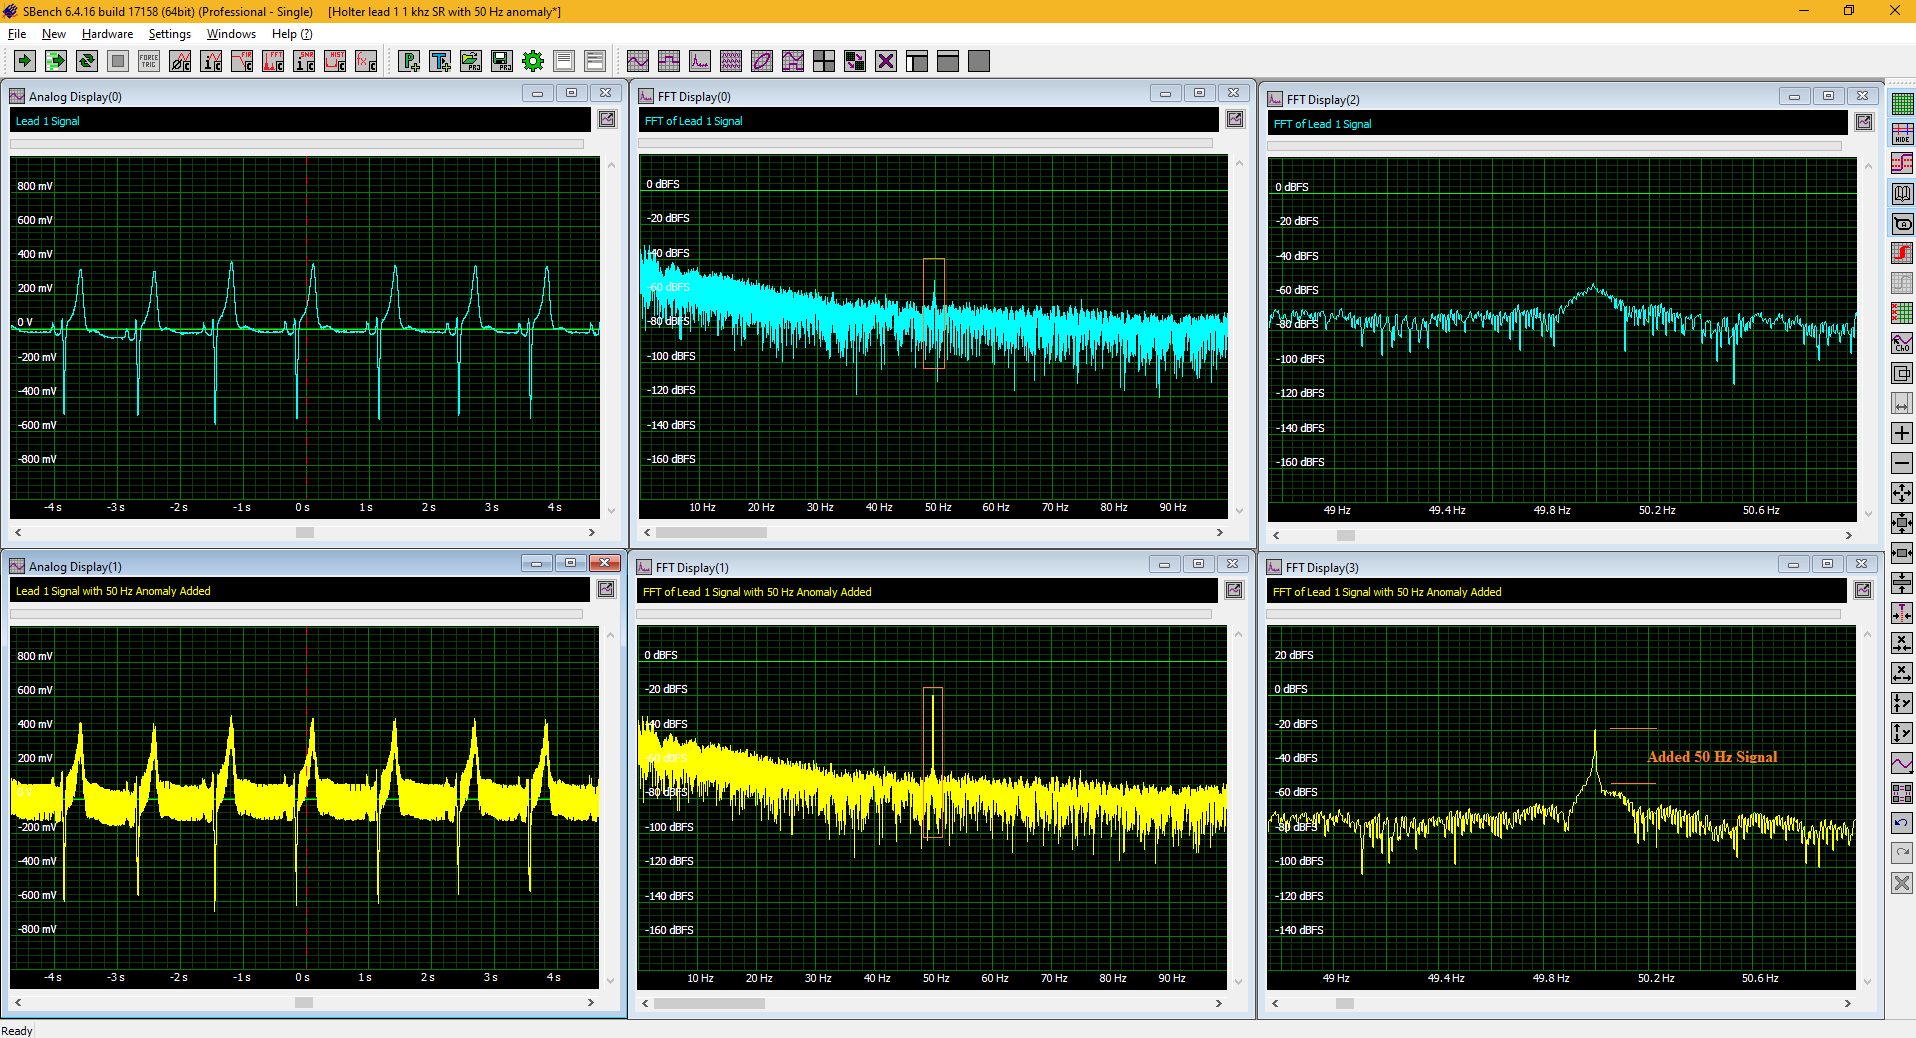
| Figure 5: Addition of a 50 Hz interference signal to the Holter lead 1 signal. |
The original lead 1 signal appears in the upper left graph, where it has been zoomed horizontally to view each cardiac cycle. The FFT of the entire signal is shown in the top center graph. The top right plot gives a horizontally zoomed representation of the FFT around 50 Hz. Note that the original signal has a small 50 Hz component. The bottom left plot shows the same signal from lead 1 after adding a 0,1 V anomaly and 50 Hz. The FFT of the signal with the 50 Hz anomaly is represented in the central graph. An orange box marks 50 Hz, which now shows a higher amplitude due to the added anomaly. The lower right graph scales the FFT horizontally by about 50 Hz. The largest amplitude of the 50 Hz interference is marked and highlighted. The ability to modify the acquired signal prior to playback allows users to evaluate the effectiveness of the filtering and error correction circuitry at any time.
Scanning and echo localization
Applications that use “echo” signals for location and exploration such as radar, sonar, lidar, or ultrasound are well suited to the capabilities of the hybridNETBOX. The arbitrary waveform generator source can supply these complex signals and the 16-bit digitizers provide the dynamic range needed to view the echo signals as shown in Figure 6.
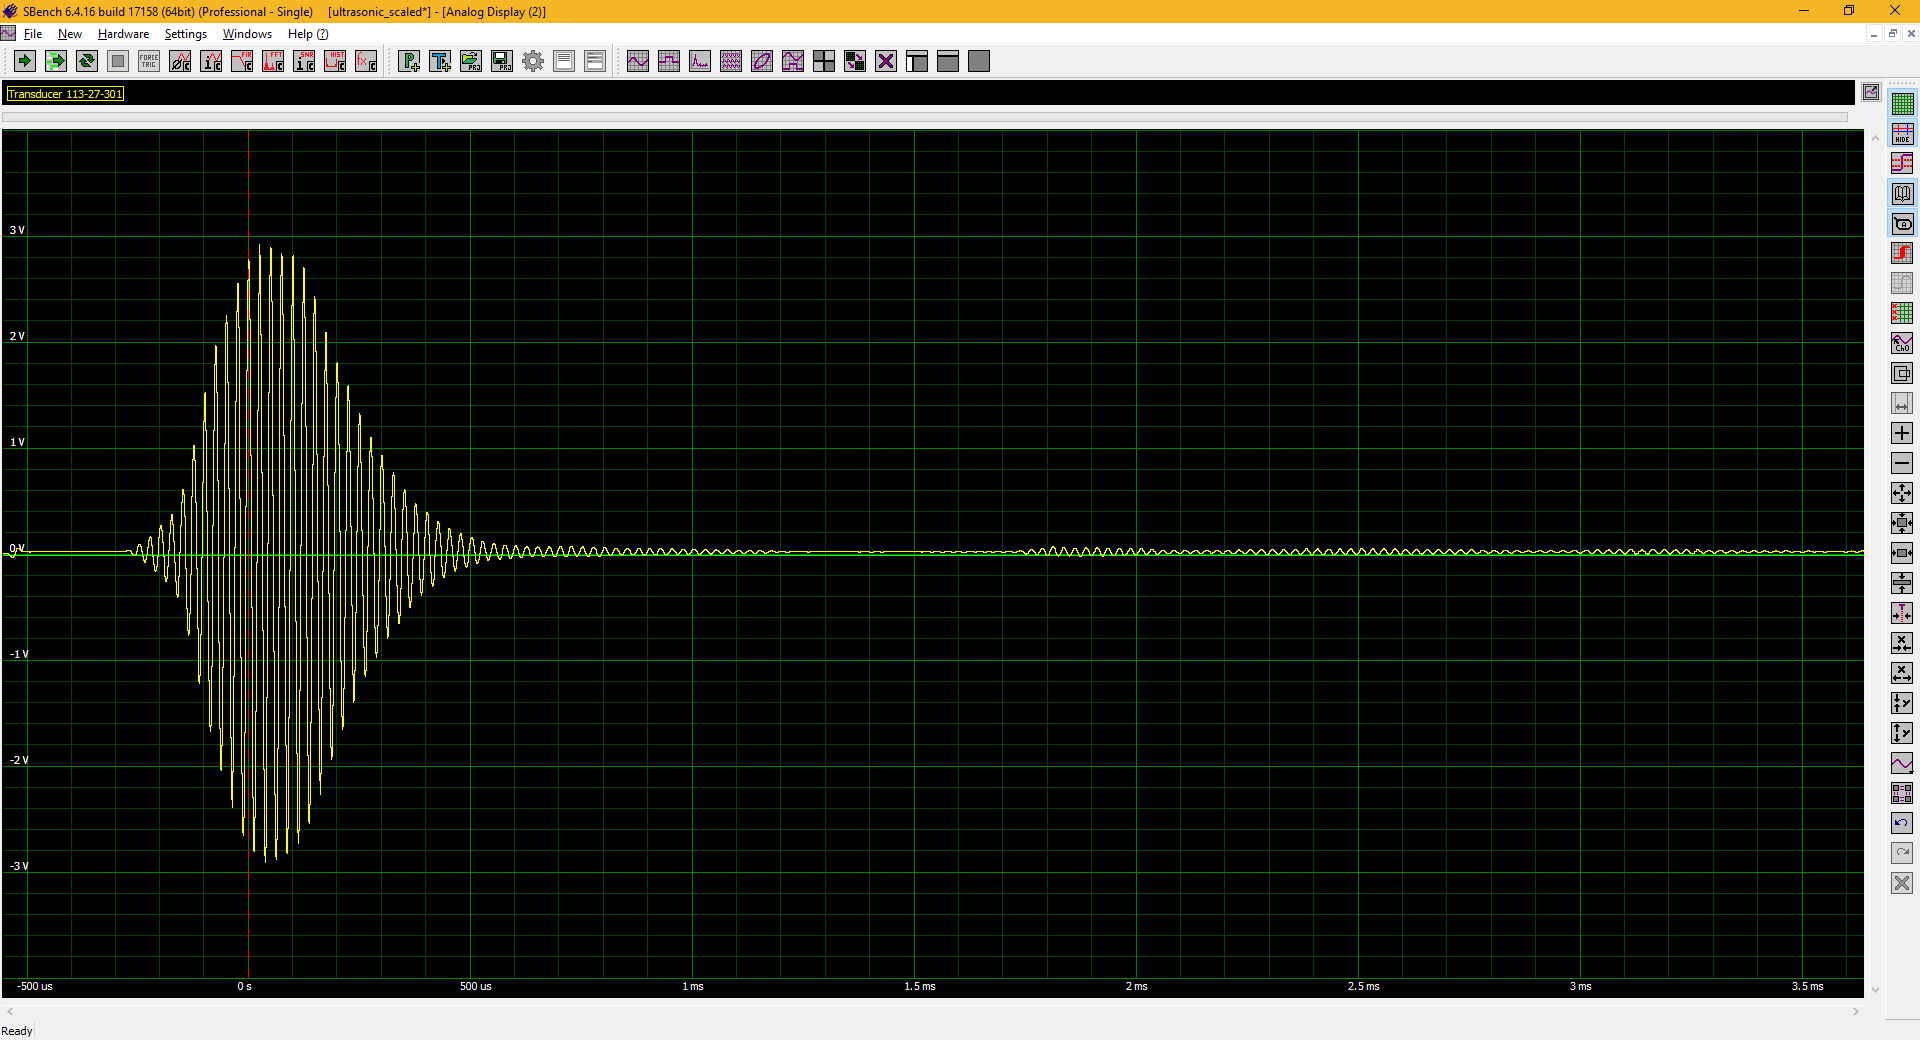
| Figure 6: Transmitted ultrasound pulse and multiple reflected echoes. |
This is a 40 kHz ultrasound pulse acquired from a rangefinder along with its back echoes. The amplitude of the echo pulses is about 36 dB below the transmitted pulse so that they can be distinguished visually in the figure. In practice they are usually much smaller! The hybridNETBOX's 16-bit amplitude resolution is important in applications like this where the echo signals are much smaller than the transmitted signal and dynamic range is needed to generate or detect low-amplitude echoes.
The multiple echoes are due to poor directionality of the ultrasound transducer. All locating and telemetry applications suffer from this problem and try to improve directionality and gain using phased arrays of transducers or antennas. Since the hybridNETBOX can generate multiple transmit signals and receive multiple channels, it is ideal for testing and evaluating these matrix-based systems.
Consider a system that processes ultrasound images in which various signals are generated and fed into a matrix of transducers. The delay and attenuation of each signal can be adjusted to control the output of the transducer array. Phased antenna systems, whether they consist of antennas for RF signals or ultrasonic transducers, are a type of MIMO (multiple input multiple output) system in common use. Multichannel arbitrary waveform generators can supply the necessary signals to control these systems and allow the orientation of the emitted signals. Similarly, a multi-channel digitizer is capable of receiving the transmitted signals. Figure 7 shows the basic signal components in an eight element ultrasonic phased transmission system.
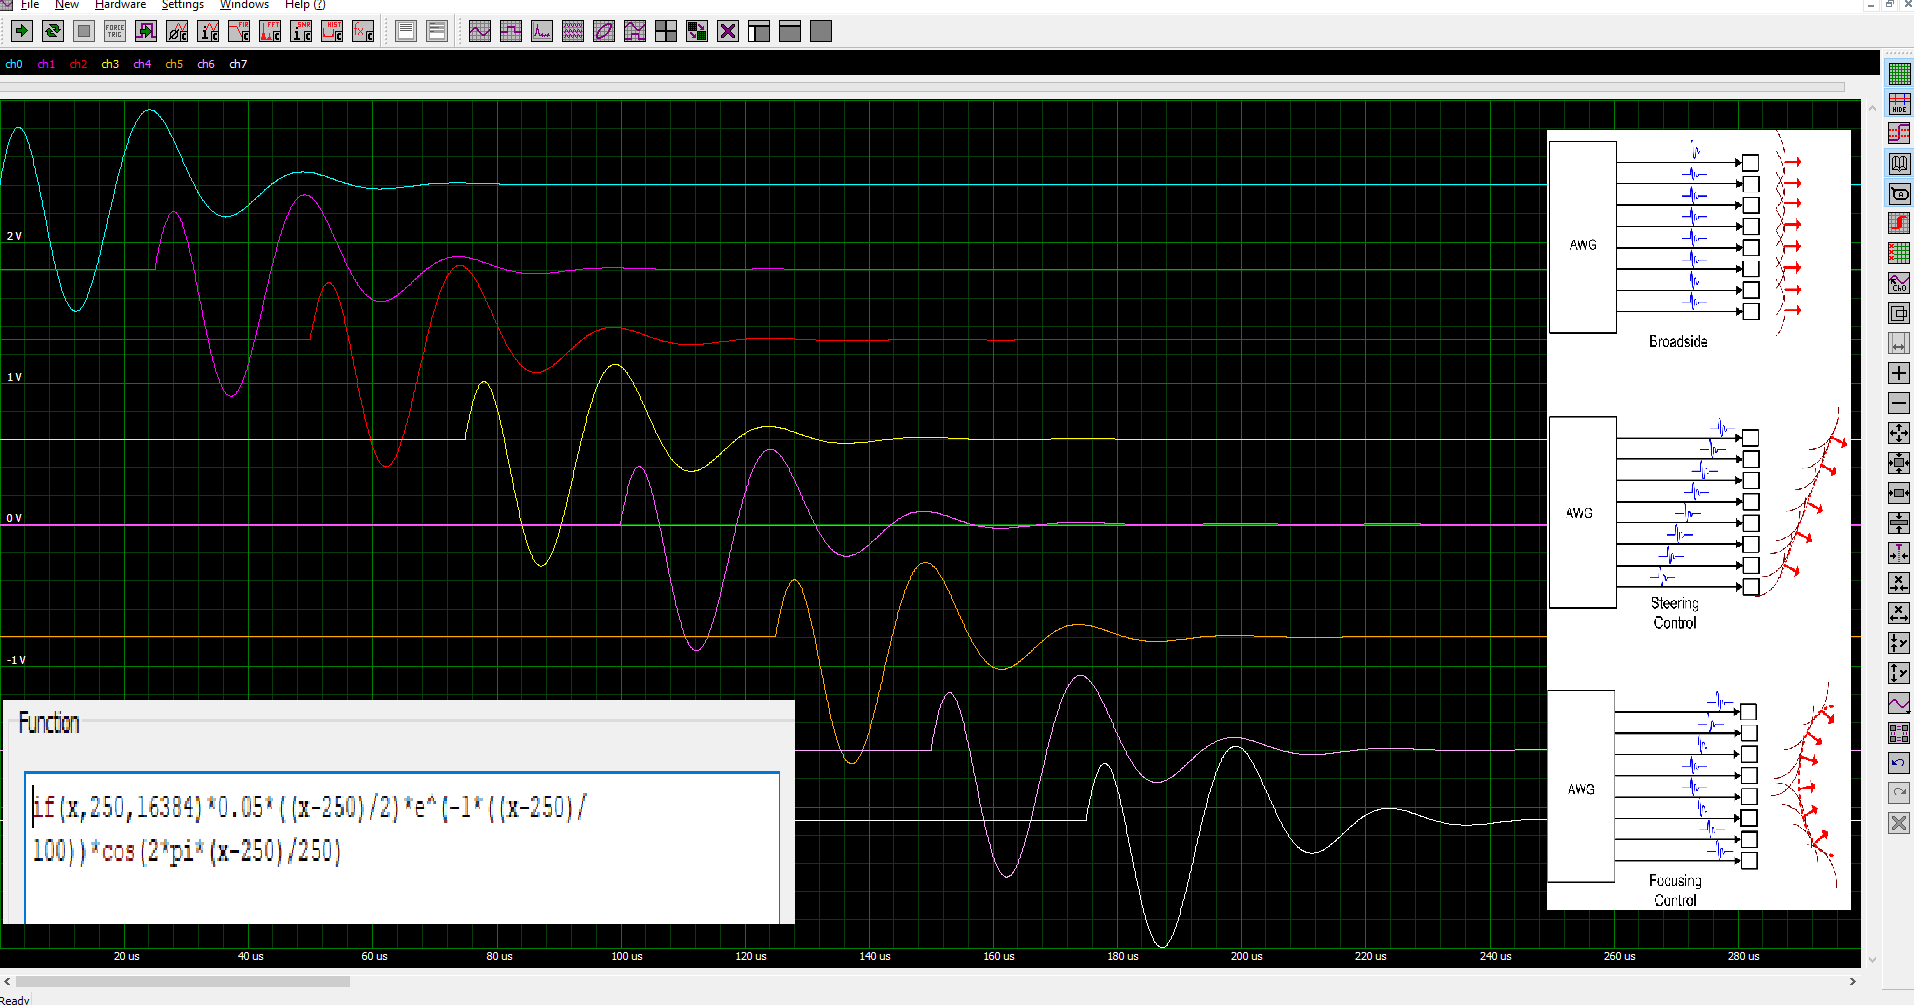
| Figure 7: These eight ultrasound waveforms, each with a 25 µs delay from the previous one, are created by eight equations, one of which appears in the box on the lower left. The other box shows the orientation or concentration options depending on the programmed delay for each waveform. |
Generating a large number of signal waveforms is made easy by SBench6's equation editor, as in the bottom left box in Figure 7. The amplitude of each waveform is modulated in cosine waves of 40kHz. Each of the eight waveforms has a 25 µs delay from the previous one. The modulation envelope consists of the full ramp, which controls the attack time, and an exponential element that determines the decay time. They are all clocked at 10 MHz and each waveform uses 16 kilosamples (kS) of the arbitrary waveform generator's 512 MS of memory. It is important that the waveform memory is large because for a given sample rate it sets the duration of the output analog waveform.
If all eight signals are in phase to arrive at the transducers at the same time, a uniform or sideways wavefront propagates as can be seen in the right inset in Figure 7. The signal transmitted from an array of ultrasonic acoustic transducers can be orient by sequential delays of each control signal. The spherical wavefronts emitted by the transducers have a spatial delay that directs the composite signal downward in the example. Similarly, if the control signals are delayed from the outside of the matrix to the inside, as in the diagram at the bottom of the box, the beam can be focused towards the center. These phased arrays allow the radiated beams to be oriented and moved by non-mechanical means. The waveforms in the example apply the orientation function and the adjustments applied to the amplitude of the control signals, in addition to the delay, allow other effects to be obtained. Users of the arbitrary waveform generator have complete control over the waveform characteristics and timing, thus offering complete flexibility in setting the emitted wavefront.
Conclusion
These examples show the power of the hybridNETBOX to provide both the signal source and test tool in a single instrument that can be used standalone or as a programmed instrument within a fully integrated test system.


