A measurement system is only as good as its weakest link. The bandwidth of an oscilloscope is always the main specification advertised by manufacturers, but a measurement system is not just made up of the oscilloscope. In fact, the oscilloscope is usually not the weakest link in the measurement system.
A measurement system is also made up of probes, cables, connectors and even fixings. Each of those items has the potential to cause more bandwidth loss than the oscilloscope. While cables and connectors typically cause very little loss, the opposite is true for probes and their accessories. Oscilloscope vendors continue to struggle to get probe bandwidths close to the oscilloscope bandwidth. This is made clear by the following example: Although 63 GHz bandwidths have been achieved with real-time oscilloscopes (Agilent's DSAX96204Q), probe bandwidths are limited to a maximum of 30 GHz (Agilent's N2803A). Agilent). The other difficulty with the bandwidth of the probes is that each vendor uses different methods to correct for non-linearity in the frequency responses. The probe correction is nothing more than a filter that is applied to the oscilloscope at the time of use so that the frequency response of the probe is flat. The flatter the frequency response, the more repeatable and accurate the measurements. The difficulties in designing high-bandwidth probes and the diversity of probe correction methods make this element a candidate for being the weakest link in the measurement system. Therefore, for maximum measurement accuracy, it is important to study characteristics other than the oscilloscope's bandwidth and understand what impact the probe's bandwidth and frequency response have.
To measure the frequency response of a probe, oscilloscope vendors typically use two different methodologies (Vin/Vout and Vsource/Vout). To understand the differences of each methodology, it is necessary to know what these key terms mean.
Ventrada: the voltage at the input of the probe as loaded by the same probe
Vout: the voltage as seen by the oscilloscope through the probe
Vsource: the voltage at the probe tip with an ideal probe; In other words, the voltage at the source without any probe connected
The goal of the Vin/Vout and Vsource/Vout frequency response corrections is to keep the response perfectly flat with respect to the probe bandwidth. This is achieved by correcting Vout until it is equal to Ventrada in the case of the Ventrada/Voutput methodology or by correcting Vout until it is equal to Vsource in the case of the Vsource/Voutput methodology. To make it clearer, Figure 1 graphically shows this representation. The basic difference between these two methods is that one includes the probe load (Vin/Vout), while the other (Vsource/Vout) does not take the probe load into account in its correction. The Vsource/Voutput correction assumption works in a 50 Ω environment (50 Ω is the hypothesized device impedance) or if the person applying the probe correction knows the impedance of the device being probed. However, as the transmission line moves away from 50 Ω, this method loses accuracy, unless the correction is changed with the source impedance. Since the Ventin/Vout method takes into account the impedance of the probe, the correction will be effective regardless of the impedance of the transmission line. Roughly speaking, maintaining accuracy regardless of the source impedance is one of the advantages of Ventin/Vout correction.
If you are not sure which correction method you should use, there is a very quick way to measure the response of the probe.
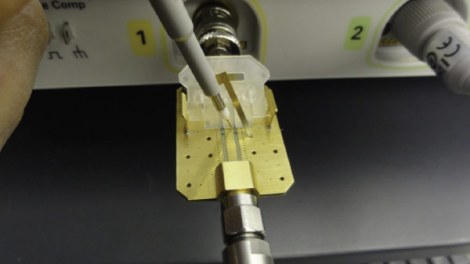
1. Using the probe calibration/deskew clamp provided by the oscilloscope vendor (such as Agilent's E2655A clamp), connect the clamp to channel 3 of the oscilloscope.
2. The E2655A provides one input and acts as a stream if you have nothing connected. Connect the input of the E2655A to the fast edge of calibration. For example, the Agilent 90000 X Series incorporates a front panel calibration fast edge that works very well for this operation. Activate the "fast edge" mode of the auxiliary output of the oscilloscope; another example is Agilent's N2806A calibration flank, since it achieves flanks of less than 10 ps.
3. Fire on the flank and do the following on channel 3:
a. Put the oscilloscope in averaging mode (a minimum of 1.000 averages).
b. Activate the fast step diff math function that you captured in step a; a pulse is created.
c. Turn on the Fast Fourier Transform (FFT) function of the pulse created in step b. This gives you the total voltage of Vsource (the voltage at the probe tip of an ideal probe).
d. Save the FFT created in step c to oscilloscope memory 1.
4. Connect any probe of your choice (preferably an active probe) to channel 1 of the oscilloscope and probe the tip of the E2655A clamp (see Figure 1).
5. The signal observed on channel 1 is the fast edge charged by the probe. In this step, the fast edge signal reflects both probe loss and probe charge in the measurement. Repeat step 3, but this time use this channel 1 signal (and save the waveform to memory 2). You should now get a new frequency response, which is the response of the probe or Vout. In steps 3 and 4 you have measured Vout and Vsource. You only need one more tension: Ventrada. This is the probe voltage at the probe tip as loaded by the probe itself. The good thing about this process is that this measure is already available to you. The transmission obtained from fixation E2655A now indicates Ventrada, since the signal has changed as a result of the loading of the probe tip.
6. To measure Ventrada, repeat step 3 again using channel 3, but now with the probe attached to the fixture. Save the new waveform to memory 3.
Now that you have obtained all three signals, simply use the divide function on the oscilloscope to see the probe correction or probe response. To measure Vin/Vout, divide the waveform in memory 3 by that in memory 2. To get the value of Vsource/Vout, divide the result in memory 1 by that in memory 2.
As before, the goal of an oscilloscope and ultimately a probe manufacturer is to correct the probe response (Vout) so that Vin is equal to Vout for Ventin/Vout correction or Vsource is equal to Vout in the case of the Vsource/Voutput methodology. The reason the vendor wants Vout to resemble Ventin (for the Ventin/Vout method) is that they don't want their customers to see huge differences in measurements caused by cable loss between a measurement that only incorporates the load of the probe (Vin) and the one the oscilloscope actually sees after the probe (Vout). By dividing Vin by Vout, the flatter the response, the better the correction obtained and the more realistic the oscilloscope's representation of the signal is. See Figures 4 and 5 for a comparison between a corrected and an uncorrected probe response measurement.
It is not the purpose of this article to discuss the advantages and disadvantages of the Ventin/Vout and Vsource/Vout probe correction methods, as both corrections have their advantages. Ultimately, Vsource/Vout corrects the probe response based on the assumption that the probe is unloaded. To apply this method, it is necessary to have some knowledge about the transmission line being probed. For the Vsource/Vout correction method, the oscilloscope manufacturer must state a hypothetical impedance of the transmission line. Part of the hypothesis that the line is 50 Ω. Although this value is the most common, not all transmission lines are the same and, if the hypothesis is not correct, the probe correction loses precision. The other method is to divide Ventin by Vout. This method includes the probe load, so its correction is independent of the source impedance.
As explained above, each oscilloscope vendor determines for the user which probe correction method is applied to their oscilloscope, and end users typically have no control over the correction method. An alternative begins to appear in the form of software that allows users to choose their correction method. Agilent Technologies offers this functionality through its PrecisionProbe software. The software allows users to measure the frequency response of the probe and then correct it. Also, with the PrecisionProbe software, users can choose the correction method. Another key feature is that if your transmission line impedance is anything other than 50 Ω, PrecisionProbe allows you to choose the source impedance. In other words, by not relying on the assumption of a 50 Ω transmission line, it makes the Vsource/Vout method always accurate regardless of source impedance.
PrecisionProbe is a novel alternative to probe correction as it provides some control of the probe response to the end user. Oscilloscope manufacturers spend years designing high-bandwidth probes to offer high bandwidth and high accuracy. Unfortunately, hardware design is not enough, and the digital signal processing (DSP) of the probes needs to be corrected to make the probes accurate.
However, even with this correction, the probe can still be the weakest link in the measurement system. To determine if this is a problem in your measurement system, you must know how to measure the response of a probe and what correction is applied to that probe. Tools such as Agilent's PrecisionProbe N2809A software are now available that make it easy to measure the frequency response of probes and also provide oscilloscope users with functionality that was previously unthinkable. Having a broader understanding of this key component of the measurement system will allow you to make more repeatable and accurate measurements.


